

Câu hỏi về Table trong IELTS gồm 2 loại: Dynamic Table và Static Table.
Dạng câu hỏi này gây khó khăn cho người học ở điểm khó nắm bắt, chọn lọc thông tin, kèm theo áp lực thời gian trong phòng thi.
Bài học cung cấp hệ thống bài tập theo mức độ để người học nắm vững các kỹ năng xử lý dạng biểu đồ này.
IELTS Writing Task 1 Table Exercises: Ôn luyện biểu đồ dạng bảng
Bài viết hướng dẫn người học cách viết dạng câu hỏi Table trong IELTS Writing Task 1 exercises thông qua một số dạng bài tập khác nhau.
Key takeaways
Trong các dạng bài của IELTS Writing Task 1, Table là một loại biểu đồ gây nhiều khó khăn cho học sinh vì sự dày đặc các số liệu cũng như việc chọn lọc các xu hướng trong bảng để phân tích. Những số liệu dày dặc này là thử thách lớn nhất đối với các thí sinh, khiến việc chọn lọc thông tin quan trọng để đưa vào bài viết trở nên bối rối đối với người học.
Do đó, người học dễ rơi vào lỗi liệt kê số liệu tràn lan, thiếu kỹ năng viết bài logic và hạn chế vốn từ vựng sử dụng trong bài. Chính vì thế, việc ôn tập có hệ thống và nắm vững các kỹ năng phân tích bài bản là điều cần thiết với các thí sinh. Bài viết này sẽ đưa ra các bài tập nhằm hướng dẫn người học cách triển khai IELTS Writing Task 1 Table và tự tin xử lý dạng bài này
Tổng quan về dạng câu hỏi Table trong IELTS Writing Task 1
Câu hỏi về Table là dạng bài nằm trong IELTS Writing Task 1, cung cấp dữ liệu về các đối tượng cụ thể thông qua các hàng và cột. Nhiệm vụ của thí sinh là báo cáo lại các thông tin chính, so sánh và đối chiếu dữ liệu một cách khách quan.
Câu hỏi về Table được chia làm 2 loại dữ liệu bảng chính:
Dynamic Table
Đây là loại bảng chứa các mốc thời gian (năm, tháng, quý), thể hiện dữ liệu thay đổi theo thời gian. Người viết cần tập trung vào sự thay đổi của các đối tượng theo các mốc thời gian.
Ở dạng bảng này, người học cần sử dụng các ngôn ngữ chỉ sự tăng - giảm, xu hướng theo các mốc thời gian, đồng thời kết hợp chỉ sự so sánh giữa các nhóm đối tượng.
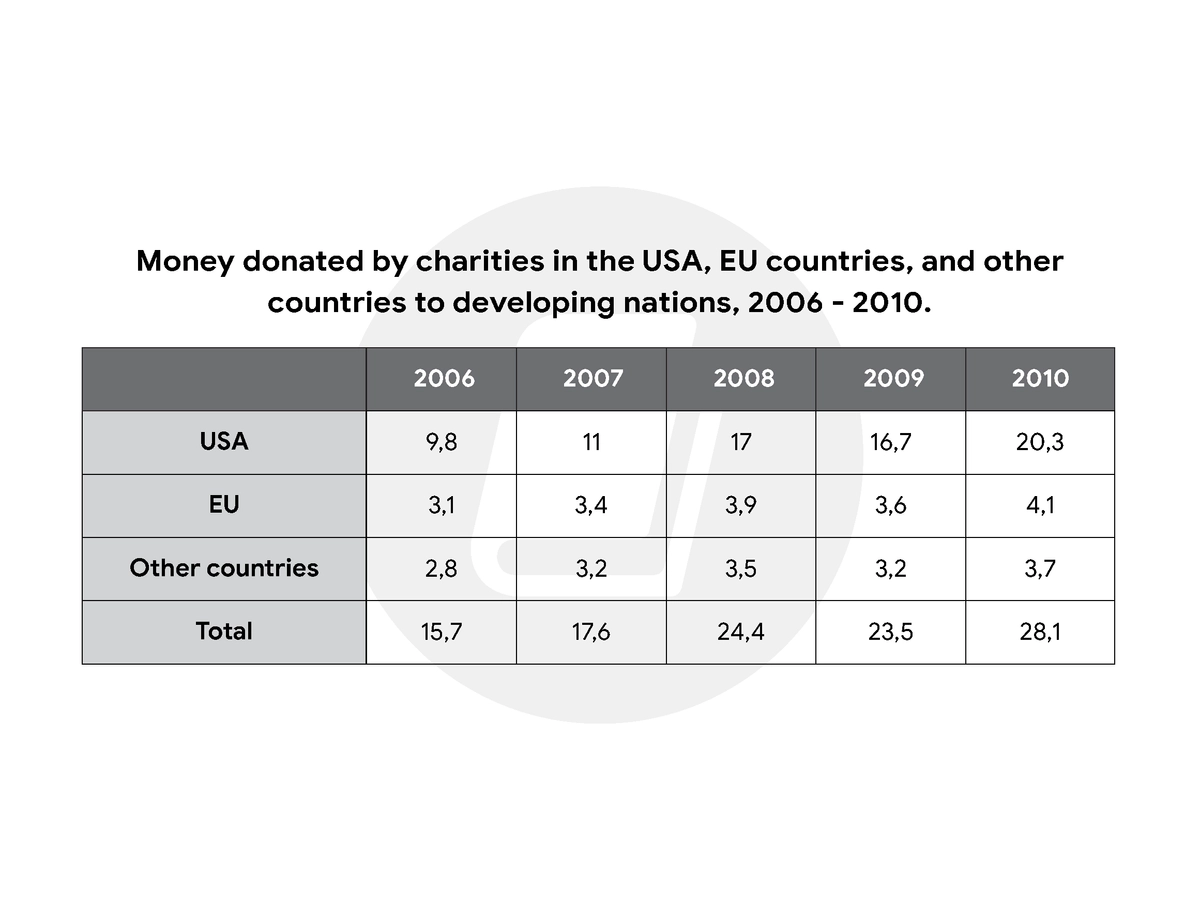
IELTS Writing task 1 - 05/2026[1]
Static Table
Đây là dạng bảng không có yếu tố thời gian, thường so sánh giữa các khu vực, các nhóm đối tượng với nhau. Người viết cần tập trung hoàn toàn vào việc so sánh các giá trị lớn nhất, nhỏ nhất và các mối tương quan giữa các đối tượng.
Ngược lại với Dynamic Table, dạng bảng này chỉ yêu cầu người học sử dụng các ngôn ngữ so sánh vì không chứa sự thay đổi theo thời gian.
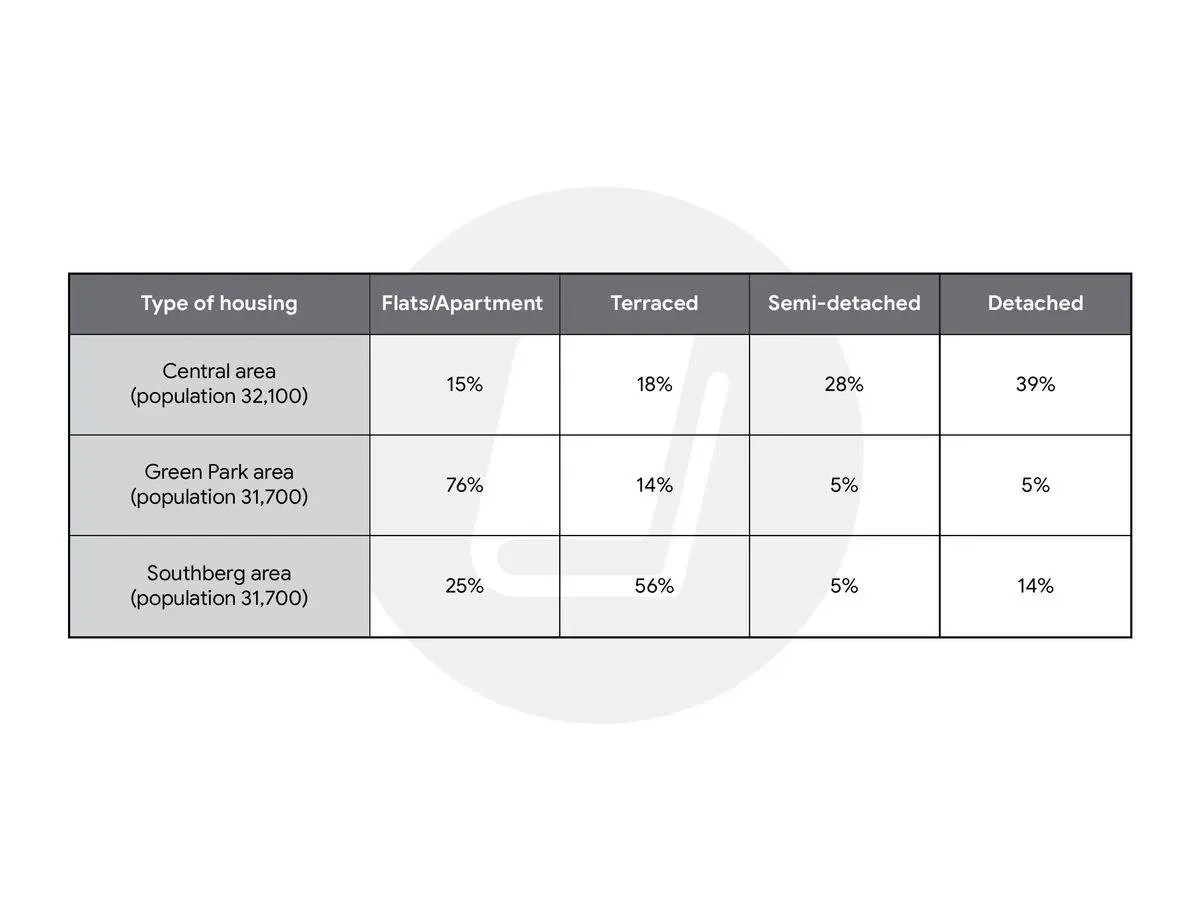
Đề thi IELTS Writing task 1 - 12/2025 [2]
Ngoài các câu hỏi dạng bảng đơn lập, các câu hỏi về Table có thể xuất hiện đi kèm với các biểu đồ khác như biểu đồ tròn,...
Với tần suất xuất hiện trong các đề thi IELTS Writing ở mức tương đối và ngày càng tăng, dạng câu hỏi này khiến nhiều người đọc gặp khó khăn trong việc chọn lọc dữ liệu và tóm gọn chúng một cách hợp lý. Dưới đây là một số lỗi người học thường mắc phải, khiến cho việc làm các câu hỏi dạng bài này ngày càng khó khăn hơn:
Lỗi về tóm lược dữ liệu: Trong quá trình làm bài, nhiều thí sinh thường có xu hướng liệt kê các nhóm dữ liệu thay vì so sánh. Chính lỗi này khiến người học chệch hướng khỏi yêu cầu của đề bài, dẫn đến mất điểm Task Achievement.
Nhóm các thông tin: Người học thường gặp các vấn đề trong việc kết hợp các nhóm thông tin lại, hoặc chia các nhóm thông tin một cách hợp lý, để tránh sự rời rạc giữa 2 đoạn.
Áp lực về thời gian: Với khối lượng thông tin cần phân tích nhiều hơn so với các dạng biểu đồ khác, đồng thời phải tóm tắt, lược bỏ thông tin khi cần khiến người học bị áp lực trong quá trình làm bài, nhất là với dạng bài chỉ nên dành 20 phút. Điều này khiến người học trở nên lúng túng, khó kiểm soát được nội dung bài viết.
Để khắc phục vấn đề này, người học cần có một chiến lược cụ thể trong phân bố thời gian và cách sắp xếp thông tin sao cho hợp lý. Người học nên xem lại bài học: Cách làm dạng bài Table trong IELTS Writing Task 1 của ZIM để biết rõ cách phân bố thời gian trong câu hỏi này.
Bài tập IELTS Writing Task 1 dạng Table
Từ những cấu trúc đã học trong các dạng biểu đồ và hướng dẫn làm bài được nêu trong Cách làm dạng bài Table trong IELTS Writing Task 1, dưới đây là một số các bài tập bổ trợ giúp người học làm quen với các dạng bài Table.
Bài 1: Viết lại phần mở bài cho các câu dưới đây
The table compares the quantity of coal consumed by four nations, namely the UK, USA, Germany, and France, in the year 2005.
The table illustrates the percentage of university students who graduated in various subjects in Canada in 2010 and 2015.
The table gives information about the number of visitors to a particular museum between 2000 and 2010.
The table compares the time spent on leisure activities by people in different age groups in 2018.
The table shows the average weekly salary of workers in three different sectors in the UK in 2020.
The table below shows the number of international students enrolled in universities in four different countries from 2005 to 2015.
The table shows the percentage of the population using the Internet in six different countries in 2020.
The table below shows the percentage of mobile phone owners using various features on their phones in 2008 and 2010.
The table below shows the number of medals won by the top five countries in the Summer Olympics from 2004 to 2016.
The table compares the percentage of household expenditure on various categories in five European countries in 2015.
Bài 2: Đọc các thông tin tóm tắt và viết Overview hoàn chỉnh cho mỗi trường hợp
Bảng về lượng khách du lịch đến 3 quốc gia từ 2010 - 2020. Số liệu: Pháp tăng mạnh và luôn đứng đầu; Anh tăng nhẹ; Ý giảm nhẹ và thấp nhất.
Bảng về tỷ lệ sử dụng internet tại 4 khu vực năm 2023. Số liệu: Bắc Mỹ cao nhất (95%), Châu Phi thấp nhất (30%).
Bảng số liệu về lượng tiêu thụ thịt bò và thịt gà tại Nhật Bản từ năm 2000 đến 2020. Số liệu: Thịt gà tăng liên tục và vượt qua thịt bò; Thịt bò có xu hướng giảm đáng kể.
Bảng so sánh tỷ lệ hoàn thành chương trình đại học ở 5 quốc gia vào năm 2024. Số liệu: Hàn Quốc đứng đầu danh sách; tất cả các quốc gia được khảo sát đều có tỷ lệ trên 40%.
Bảng về doanh thu từ 3 loại hình giải trí (Phim ảnh, Âm nhạc, Trò chơi điện tử) toàn cầu từ 2015 - 2025. Số liệu: Cả 3 đều tăng; Trò chơi điện tử tăng trưởng bùng nổ và luôn giữ mức doanh thu lớn nhất.
Bảng số liệu về tỷ lệ thất nghiệp ở Mỹ và Nhật Bản từ 2010 - 2020. Số liệu: Cả hai quốc gia đều có xu hướng giảm; tỷ lệ ở Mỹ luôn cao hơn Nhật Bản.
Bảng so sánh chi tiêu cho thực phẩm và giải trí của 4 quốc gia năm 2023. Số liệu: Tất cả các nước đều chi nhiều tiền cho thực phẩm hơn giải trí; người Pháp chi cho thực phẩm cao nhất.
Bảng về giá trị xuất khẩu 3 mặt hàng (Gạo, Cà phê, Cao su) của Việt Nam năm 2024. Số liệu: Gạo có giá trị xuất khẩu cao nhất; tổng giá trị của cả 3 mặt hàng đều tăng so với năm trước.
Bài 3: Điền từ vào chỗ trống thích hợp [3]
The table provides information about household budgets in a European country from 1920 to 1980.
Provide an overview of the information by identifying and describing the key details, and include comparisons where appropriate.

allocated/ a dramatic increase/ increase/ dominated/ fluctuated/ experienced the steepest decline/ a quarter/ gradually/ proportions/ replaced/ relatively stable
The table compares the (1) ____________ of expenditure across six different categories in an unnamed European country between 1920 and 1980.
Overall, households spent progressively less on necessities such as food and clothing, while the budget allocated to housing and transportation expanded significantly. By the end of the period, housing had (2) ____________ food as the largest household expense, whereas spending on healthcare remained (3) ____________.
In 1920, food was by far the largest expenditure, accounting for 41% of the total budget. However, this figure (4) ____________ to 32% in 1950, before dropping further to 19% by 1980. Similarly, clothing expenses shrank considerably from 17% to just 5% over the 60-year period. In contrast, housing (5) ____________ household spending in the second half of the period, increasing (6) ____________ from 26% in 1920 and 1950 to 29% in both 1960 and 1970, and ultimately reaching a peak of 33% in 1980.
Among the remaining categories, transportation witnessed (7) ____________, surging from a negligible 3% in 1920 to (8) ____________ of the total budget (25%) in 1980. Meanwhile, families (9) ____________ only a modest share of their income to healthcare, which hovered consistently between 4% and 6%. Finally, other miscellaneous expenses rose from 9% initially and then (10) ____________ within a narrow band of 13% to 14% from 1950 onwards.
Xem thêm:
Bài 4: Viết một bài văn hoàn chỉnh cho các đề bài sau
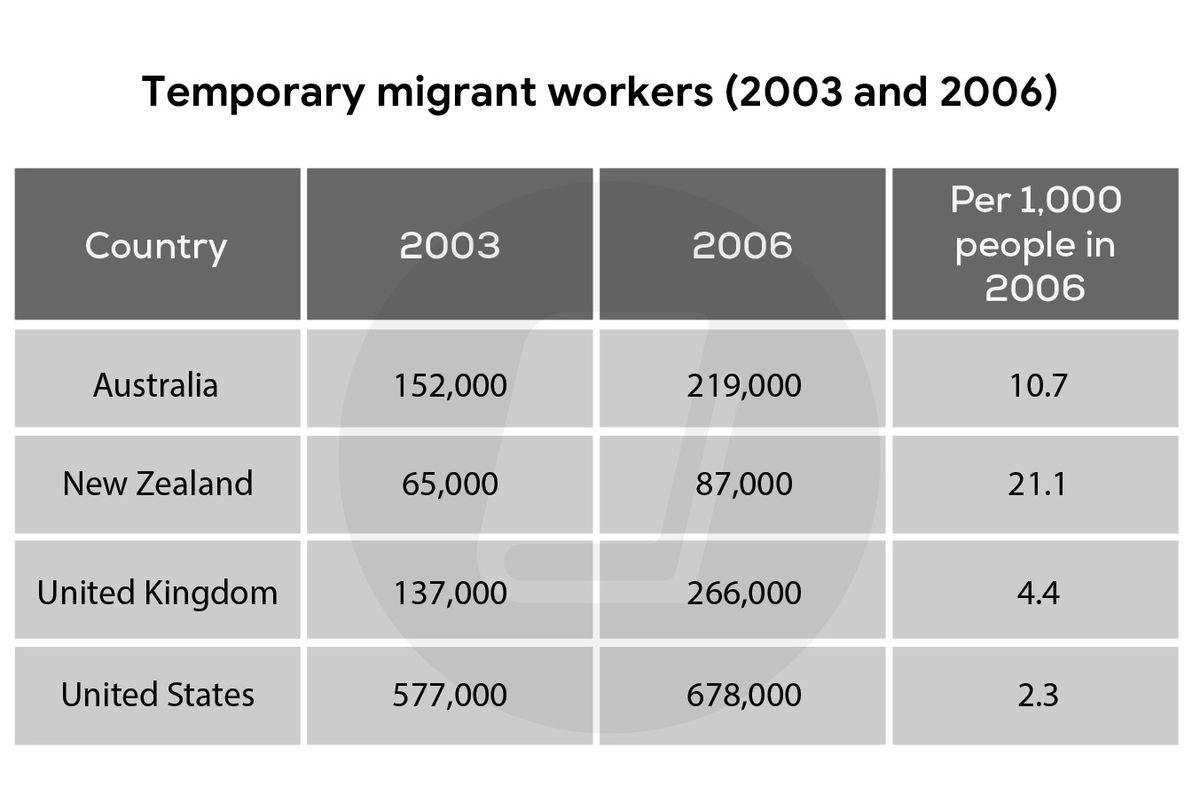
The table below shows the number of temporary migrant workers in four countries in 2003 and 2006 and the number of these workers per 1,000 people in these countries in 2006.
Summarise the information by selecting and reporting the main features, and make comparisons where relevant.
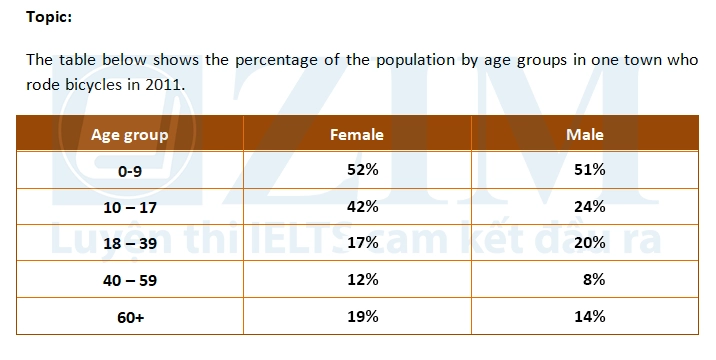
The table below shows the percentage of the population by age groups in one town who rode bicycles in 2011.
Summarise the information by selecting and reporting the main features, and make comparisons where relevant.
Đáp án tham khảo
Bài 1:
The table provides a comparison of coal consumption across four nations (the UK, USA, Germany, and France) in 2005.
The table presents data on the proportions of university graduates in various fields of study in Canada for the years 2010 and 2015.
The table indicates the figures for individuals visiting a specific museum over a 10-year period starting from 2000.
The table highlights the amount of time allocated to recreational activities by different age groups in 2018.
The table demonstrates the typical weekly earnings of employees in three distinct sectors in the UK during 2020.
The table details the number of overseas students enrolled at universities in four countries between 2005 and 2015.
The table depicts the percentage of people using the Internet in six separate nations in the year 2020.
The table compares the usage of different mobile phone features among owners in 2008 and 2010.
The table displays the quantity of medals achieved by the leading five countries in the Summer Olympics from 2004 to 2016.
The table illustrates how much households in five European countries spent on various categories in 2015.
Bài 2:
Overall, France and the UK saw an increase in tourist arrivals, while Italy experienced a slight decline. France remained the most popular destination throughout the period, whereas Italy consistently recorded the lowest figures.
Overall, internet usage rates varied significantly by region, with North America having the highest penetration. In contrast, Africa recorded the lowest percentage of internet users.
Overall, chicken consumption followed an upward trend and eventually overtook beef. Conversely, the figure for beef saw a significant decrease over the 20-year period.
Overall, South Korea had the highest university completion rate among the five nations. Notably, the graduation figures for all surveyed countries were above 40%.
Overall, global revenue for all three entertainment sectors grew. Video games, however, showed explosive growth and remained the dominant revenue generator throughout the timeframe.
Overall, both the USA and Japan saw a downward trend in unemployment rates. Nevertheless, the percentage of unemployed people in the USA was consistently higher than in Japan.
Overall, expenditure on food was higher than on entertainment in all four countries. Among them, French citizens spent the most on food.
Overall, rice was the leading export product in terms of value. Additionally, there was a general increase in the total export value of all three commodities compared to the previous year.
Bài 3:
The table compares the (1) proportions of expenditure across six different categories in an unnamed European country between 1920 and 1980.
Overall, households spent progressively less on necessities such as food and clothing, while the budget allocated to housing and transportation expanded significantly. By the end of the period, housing had (2) replaced food as the largest household expense, whereas spending on healthcare remained (3) relatively stable.
In 1920, food was by far the largest expenditure, accounting for 41% of the total budget. However, this figure (4) experienced the steepest decline to 32% in 1950, before dropping further to 19% by 1980. Similarly, clothing expenses shrank considerably from 17% to just 5% over the 60-year period. In contrast, housing (5) dominated household spending in the second half of the period, increasing (6) gradually from 26% in 1920 and 1950 to 29% in both 1960 and 1970, and ultimately reaching a peak of 33% in 1980.
Among the remaining categories, transportation witnessed (7) a dramatic increase, surging from a negligible 3% in 1920 to (8) a quarter of the total budget (25%) in 1980. Meanwhile, families (9) allocated only a modest share of their income to healthcare, which hovered consistently between 4% and 6%. Finally, other miscellaneous expenses rose from 9% initially and then (10) fluctuated within a narrow band of 13% to 14% from 1950 onwards..
Bài 4:
Người học tham khảo: Bài mẫu IELTS Writing Task 1 ngày 13/01/2024
Người học tham khảo: Bài mẫu IELTS Writing Task 1 ngày 01/02/2018
Tổng kết
Bài viết trên đã giúp người học ôn luyện một số cách viết trong dạng bài Table của IELTS Writing Task 1, qua đó người học rèn luyện được khả năng tóm tắt, chọn lọc thông tin trong quá trình làm bài.
Để củng cố kỹ năng phân tích bảng và tổ chức bài IELTS Writing Task 1, người học có thể tham khảo Khóa học IELTS cá nhân hóa và cam kết đầu ra 4 kỹ năng, với lộ trình phù hợp và hệ thống học tập cá nhân hóa.
Tham vấn chuyên môn
Lê Hoàng TùngGiáo viên
Định hướng giáo dục: "In teaching others, we teach ourselves"
Đây chính là động lực để giáo viên đào sâu nghiên cứu, tìm tòi và phát triển chuyên môn và kĩ năng giảng dạy của bản thân, góp phần mở khóa được tiềm năng ngôn ngữ của học viên.
Nguồn tham khảo
1
“Phân tích đề IELTS Writing Task 1 tháng 5/2026 - Đề số 3.” ZIM Academy, https://zim.vn/phan-tich-de-ielts-writing-task-1-thang-5-2026-de-so-3. Accessed 7 September 2026.
2
“Phân tích Đề IELTS Writing tháng 12/2025 - Đề số 1.” ZIM Academy, https://zim.vn/phan-tich-de-ielts-writing-thang-12-2025-de-so-1. Accessed 7 September 2026.
3
“Bài tập điền từ IELTS Writing task 1 table.” Gemini AI, https://gemini.google.com/app/7428ee02cd52ade3. Accessed 7 September 2026.


Bình luận - Hỏi đáp