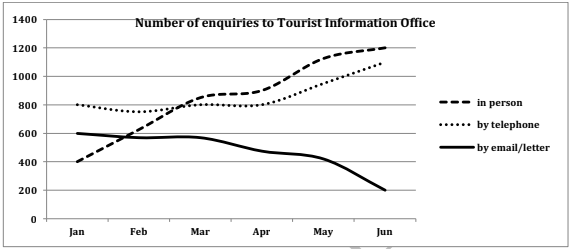
The line graph illustrates the number of enquiries to the Tourist Information Office in one city from January to June in 2011.
Overall, it can be concluded from the given information that the number of inquiries by telephone and in person saw an upward trend, while that by email or letter decreased throughout the period shown. Among them, the number of inquiries made in person experienced the most significant changes.
In January 2011, the Tourist Information Office received 800 telephone inquiries, while inquiries via email or letter they received was just 600. This month, in-person queries were only half of telephone queries, being the least popular communication method ( around 400 ). From January to March, the face-to-face inquiries rose suddenly to nearly 800, being the same number as inquiries by phone. In the same period, small changes were witnessed in the number of queries via email or letter.
Between March and June, the number of inquiries made in person continued to grow dramatically to reach a peak at nearly 1200. After remaining stable from March to April, there was an increase of over 200 in the figure for telephone queries. In contrast, fewer people sent emails or letters to make inquiries, and the number fell into a downward spiral until it hit the lowest point at merely 200.