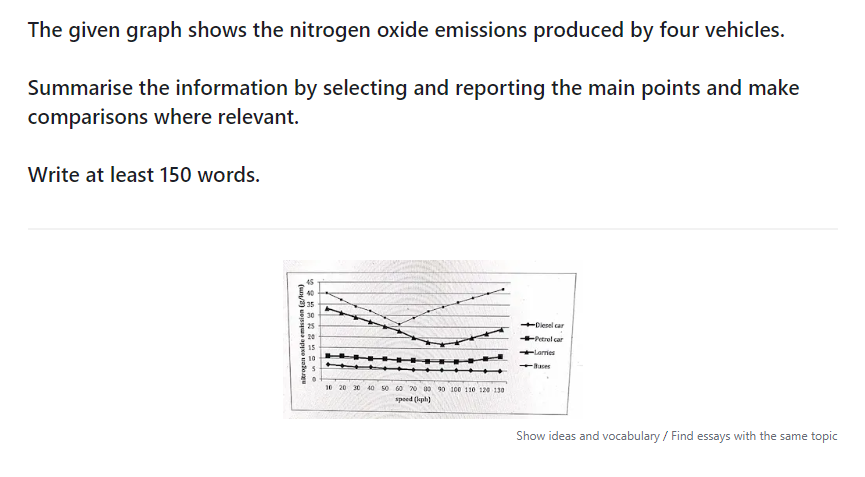
The line graph illustrates the nitrogen oxide emissions generated by four transports (diesel cars, petrol cars, lorries, and buses) when they speed up from 10 kph to 130 kph.
Overall, buses are always the means of transport that produce the most harmful gases, which is in contrast with diesel cars in all speeds.
It is evident that the faster the average speed of buses and lorries increases, the fewer emissions are emitted. However, when the velocity surpasses 60 kph with buses and 90 kph with lorries, the emissions produced increase again. At the same time, buses also discharged twice as much nitrogen oxide as lorries before peaking at 43 g/km and 25 g/km, respectively.
Besides, looking at the diagram, when the driver accelerates from 10 kph to 130 kph, if using diesel cars or petrol cars, toxic gases remain almost unchanged, recorded at only roughly 10 g/km and 5 g/km, respectively.
In addition to that, buses are the most safe and environmentally friendly vehicle when the rate surges to 130 kph.
Em chào thầy cô ạ, trước em có được thầy cô zim chấm, thì được 6.5 (TA: 7.0, CC: 7.0, LX: 6.0, GR: 6.0 )
Và được nhận xét như này ạ: Hướng cải thiện tiếp theo:
1) Cần làm nổi bật, đầy đủ hơn các key feature - Ý
2) Chú ý kiểm tra kĩ cách paraphrase có chính xác không? - paraphrase
3) Bổ xung các collocations
4) Bổ xung ngữ pháp khó: Đảo ngữ - ngữ pháp
5) Chú ý không lặp ý với phần overall - Ý
6) Xu hướng giống nhau => Không nên lặp lại - Ý
7) Rút ngắn bài chỉ còn 150-170 từ
Dưới đây là bài của em ạ, em rất mong có thể nhận được feedback từ thầy cô, về điểm mạnh, điểm yếu, và điểm overall trong bài này. Với cả, em đang căn cứ vào những 7 vấn đề kia để làm mục tiêu cho bài này nữa, nên thầy cô cũng cho em xin nhận xét là tình hình của em đã cải thiện hơn trước chưa ạ?