Essential Vocab for SAT® Math - Problem Solving and Data Analysis | Unit 1: Data and Random
Key takeaways
Ghi nhớ hai từ vựng quan trọng trong SAT Math:
Data: dữ liệu
Random: ngẫu nhiên
Ứng dụng trong bài toán:
Dựa trên dữ liệu (Based on data)
Sử dụng dữ liệu cho tính toán (Use data to calculate)
Chọn mẫu ngẫu nhiên (Random sample selection)
Khảo sát ngẫu nhiên (Random survey)
Trong toán học, đặc biệt là SAT Math, hiểu rõ ý nghĩa của các từ khóa có thể giúp người học làm bài nhanh hơn và chính xác hơn. Trong phần Problem Solving and Data Analysis, hai khái niệm cần đặc biệt chú ý là “data” (dữ liệu) và “random” (ngẫu nhiên). Bài viết sẽ giúp người học nhận diện và vận dụng chúng hiệu quả trong các dạng toán thực tế, thông qua ví dụ cụ thể và bài tập luyện tập.
Data (noun): dữ liệu
Định nghĩa
Trong toán học, “data” (dữ liệu) thường đề cập đến thông tin dạng số hoặc biểu đồ được dùng để phân tích, so sánh hoặc dự đoán. Dữ liệu có thể được trình bày dưới dạng bảng, đồ thị, biểu đồ tần suất, hoặc mô tả bằng lời.

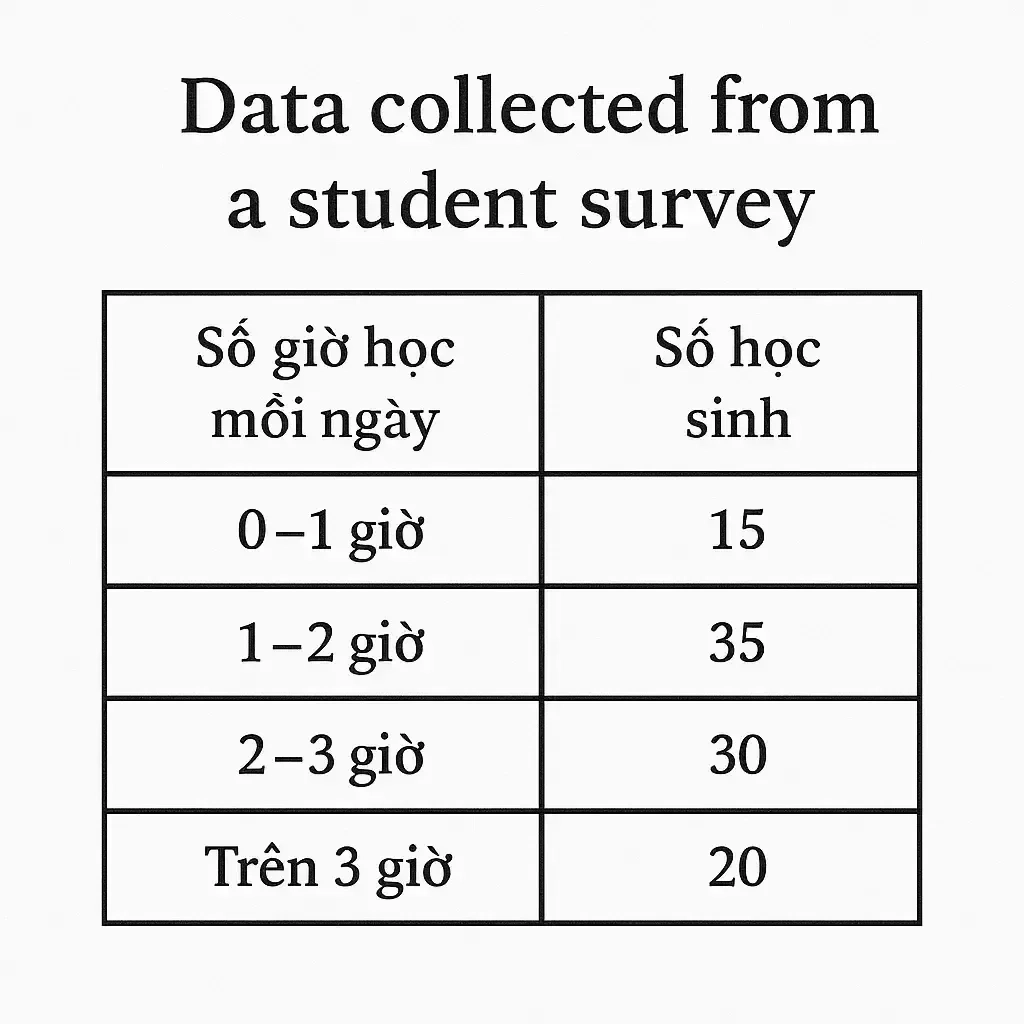
Ví dụ: Một khảo sát được thực hiện trên 100 học sinh về số giờ họ học mỗi ngày. Dữ liệu thu được như sau:

Trung bình mỗi học sinh học bao nhiêu giờ mỗi ngày?
→ Đây là bài toán phân tích data – sử dụng bảng dữ liệu để tính toán trung bình (mean).
Ví dụ liên quan
Data point (noun): điểm dữ liệu
Là một giá trị đơn lẻ trong tập dữ liệu, thường biểu diễn một quan sát hoặc phép đo.
Ví dụ: Trong bảng khảo sát thời gian học, “2 giờ – 30 học sinh” là một data point.
Outlier (noun): giá trị ngoại lai
Là một điểm dữ liệu khác biệt rõ rệt so với phần còn lại của tập dữ liệu.
Ví dụ: Trong tập {10, 12, 11, 13, 55}, số 55 là một outlier.
Trend (noun): xu hướng
Là mô hình thay đổi chung của dữ liệu theo thời gian hoặc điều kiện nào đó.
Ví dụ: Biểu đồ doanh thu cho thấy xu hướng tăng đều qua các tháng.
Random (adjective): ngẫu nhiên
Định nghĩa
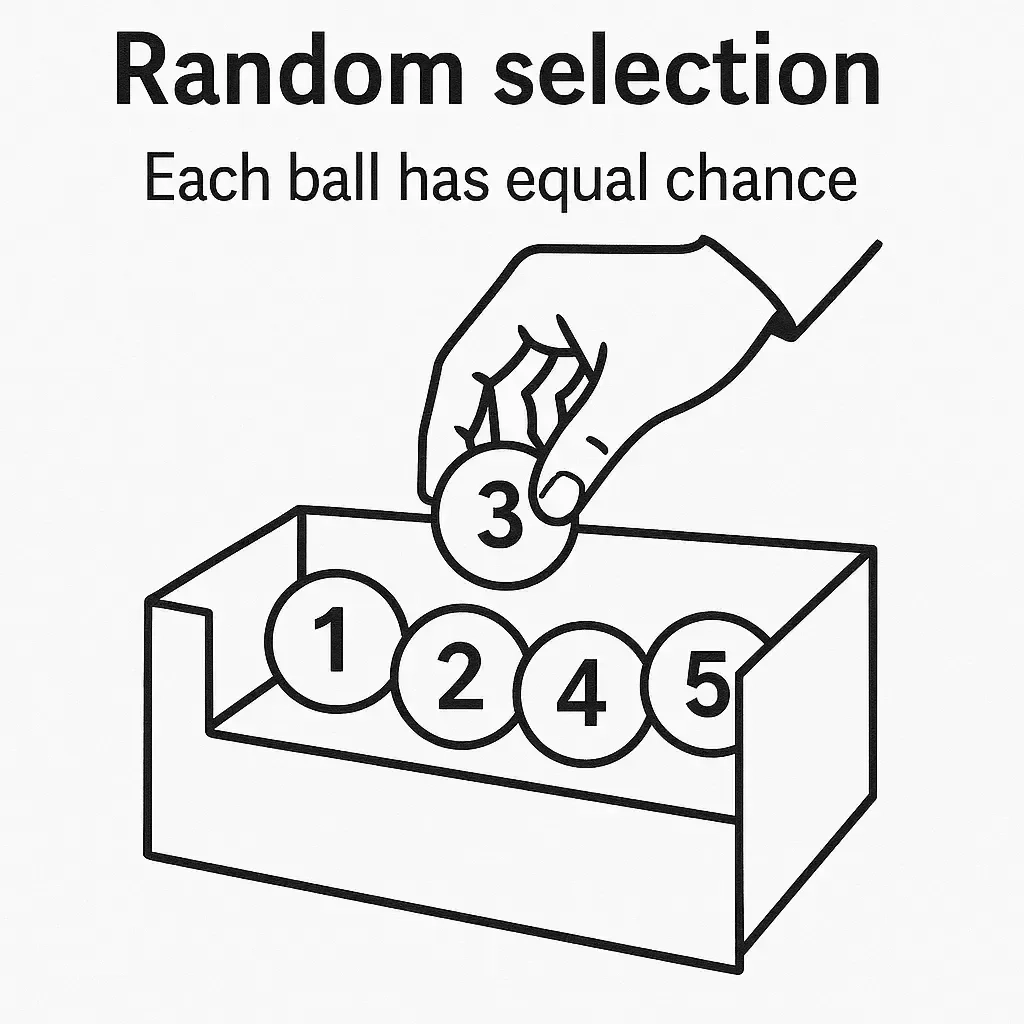
Trong toán học, “random” (ngẫu nhiên) mô tả một lựa chọn hoặc kết quả xảy ra không theo quy luật nào và không thể dự đoán trước. Trong SAT Math, từ này thường dùng trong các bài toán xác suất, nơi mỗi kết quả có cơ hội xảy ra như nhau.
Ví dụ: Một chiếc hộp chứa 5 quả bóng được đánh số từ 1 đến 5. Một quả bóng được rút ngẫu nhiên từ hộp. Xác suất để rút được quả bóng số 3 là bao nhiêu?

→ Giải thích: Vì việc chọn bóng là random, nên mỗi quả có xác suất bằng nhau là 1/5.
Ví dụ liên quan
Random sample (noun): mẫu ngẫu nhiên
Tập hợp được chọn từ tổng thể sao cho mỗi phần tử có cơ hội được chọn như nhau.
Ví dụ: Chọn ngẫu nhiên 50 học sinh từ toàn trường để làm khảo sát.
Random interval (noun): khoảng ngẫu nhiên
Khoảng giá trị được tạo ra ngẫu nhiên, dùng để mô tả phạm vi ước lượng trong thống kê.
Ví dụ: Khoảng ước lượng 90% cho điểm trung bình là từ 72 đến 78.
Random variable (noun): biến ngẫu nhiên
Biến nhận giá trị số dựa trên kết quả của một phép thử ngẫu nhiên.
Ví dụ: Số lần xuất hiện mặt ngửa khi tung 3 đồng xu là một biến ngẫu nhiên.
Kiểm tra từ vựng
Kiểm tra từ vựng - data
Fill in the blank with one of these words: outlier, trend, data point
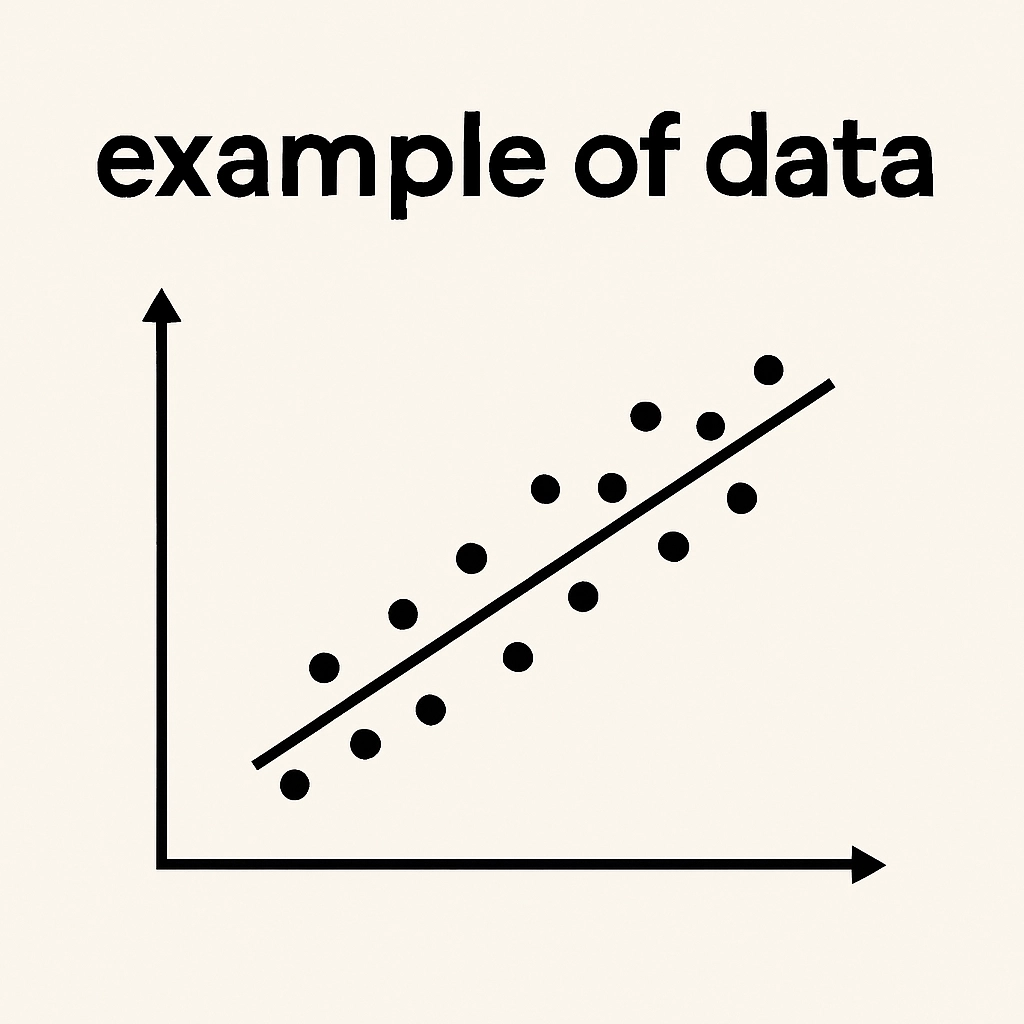
On a scatterplot, each dot represents a single ________________.
A point that lies far from the others and does not follow the general pattern is called an ________________.
When the values generally increase or decrease, we say there is a clear ________________.
Kiểm tra từ vựng - random
Exercise 1: Match each term with its suitable definition.
Term | Definition |
|---|---|
1. Random Interval | A. A value or outcome determined by chance that can vary in a probabilistic experiment. |
2. Random Variables | B. A subset chosen from a larger group, where each member has an equal chance of being selected. |
3. Random Sample | C. A range of values generated based on random selection, often used in simulations or probability. |
Exercise 2: Fill in the blank with one of these words: random interval, random variables, random sample
A ________________ is a subset of a population selected in a way that each member has an equal chance of being chosen.
The value of the ________________ depends on the outcome of a probability experiment.
The wait time for a bus arriving between 8:00 a.m. and 8:30 a.m. can be modeled by a ________________.
Bài toán thực tế
Bài toán thực tế - data
Exercise 1: A report from a fitness tracker company shows that for every 5 minutes a person walks, they burn approximately 18 calories.
Based on this data, how many calories would a person burn in 20 minutes of walking?
If a person wants to burn at least 100 calories by walking, how many minutes should they walk, based on the data?
Exercise 2: A local health report provides data that recommends public staircases have a maximum step height of 7 inches for safety and accessibility.
If a staircase has a total rise of 35 inches, what is the minimum number of steps required to follow this guideline?
A staircase has 4 steps and a total rise of 30 inches. Based on the data, is this staircase within the recommended step height limit? Why?
Bài toán thực tế - random
Exercise 1: A school wants to conduct a survey about students’ lunch habits. From a total of 1,200 students, the principal decides to take a random sample of 10% of the students to ensure fairness.
How many students should be included in the random sample?
One class of 60 students is chosen entirely for the survey. Based on the original method, is this selection representative of the whole school? Why or why not?
Exercise 2: A statistics teacher wants to choose a random sample of students from a group of 200 to test a new question format. She plans to select only 8% of the students for the trial.
How many students should be included in the random sample?
If she selects 20 students from the same class, is this selection method valid based on the plan? Why or why not?
Đáp án
Đáp án - data
Kiểm tra từ vựng
data point
outlier
trend
Bài toán thực tế
Exercise 1:
72 calories
28 minutes
Exercise 2:
5 steps
7.5 inches > 7 inches —> No
Đáp án - random
Kiểm tra từ vựng
Exercise 1:
1 – C
2 – A
3 – B
Exercise 2:
random sample
random variables
random interval
Bài toán thực tế
Exercise 1:
120 students
No
Exercise 2:
16 students
No. Choosing 20 students from one class doesn’t represent all 200 students — it’s not random and introduces bias.
Tổng kết
Việc hiểu và vận dụng chính xác hai khái niệm “data” (dữ liệu) và “random” (ngẫu nhiên) có ý nghĩa quan trọng trong phần toán SAT, đặc biệt là các câu hỏi liên quan đến thống kê và xác suất. Khi nắm vững bản chất của dữ liệu và tính ngẫu nhiên, học sinh có thể phân tích đề hiệu quả, rút ngắn thời gian làm bài và tăng độ chính xác.
Tài liệu Think in SAT Digital Math – Reasoning and Strategies là nguồn học chuyên sâu với lý thuyết nền tảng, ví dụ minh họa và bài tập thực hành có lời giải, giúp người học củng cố kiến thức và tư duy chiến lược. Đồng thời, khóa học SAT mới cải tiến của ZIM mang đến lộ trình cá nhân hóa, phương pháp học từ vựng theo bối cảnh và giáo trình độc quyền – hỗ trợ tối đa cho mục tiêu điểm số.
SAT® is a trademark registered by the College Board, which is not affiliated with, and does not endorse, this website.
- Essential Vocab for SAT Math - Problem Solving and Data Analysis
- Essential Vocab for SAT® Math - Problem Solving and Data Analysis | Unit 2: Sum and Probability
- Essential Vocab for SAT® Math - Problem Solving and Data Analysis | Unit 1: Data and Random
- Essential Vocab for SAT® Math - Problem Solving and Data Analysis | Unit 7: Margin of error + Median
- Essential Vocab for SAT® Math - Problem Solving and Data Analysis | Unit 3: Difference and Generalize
- Essential Vocab for SAT® Math - Problem Solving and Data Analysis | Unit 5: Whole number and Range
- Essential Vocab for SAT® Math - Problem Solving and Data Analysis | Unit 4: Biased and Unbiased
- Essential Vocab for SAT® Math - Problem Solving and Data Analysis | Unit 6: Ratio and proportion

Bình luận - Hỏi đáp